Paris is rainier than Copenhagen 🌧️
Analysis of data from Météo France and DMI to compare precipitation in the two capitals.

Introduction
To most, inhabitants and visitors alike, Copenhagen is a rainy city. That could include me: one of the biggest mistakes I’ve made living here on day was to forget my rain jacket and arrive home completely soaked by a sudden rain shower. It has never leaved my backpack ever since. But how does it compare to a city like Paris? I wanted to look at the raw data and find out myself. Here’s a summary of my observations, followed by a short go-through of the steps I took.
Data from two met stations were used
This article is based on 20 years of observations (2005-2024) from the Copenhagen Airport met station and from the Parc Montsouris met station in Paris. I explain in more detail in the Methodology section in appendix how I proceeded to collect and analyze the data.


The location of the two met stations used in this article: Copenhagen Airport (left-- credit: Kallerna for Wikimedia Commons), and Parc Montsouris in Paris (right-- credit: Jean-Pierre Viguie/Ville de Paris)
First things first
Let's go straight to the first point: the result is clear-cut if you look at Table 1 below.
| Copenhagen | Paris |
|---|---|
| 600.5 | 635.1 |
On average, it rains 6% more in Paris than in Copenhagen. We can see that general trend looking at the past 20 years in Figure 1. It has been particularly bad in Paris recently, as the top ~3 rainiest years have all been in the past 5 years. 2024 has even entered history books as the rainiest ever recorded in Paris [1].
So what may contribute to this perception of a rainier city?
Seasonal variations
As shown in Figure 2, Copenhagen tends to be drier from November to June but experiences more rainfall during the summer months. In Denmark, rain often falls when you’d expect sunshine, which can make it feel like bad luck– especially if you’ve hoped for a sunny summer and chosen to stay up north for your holidays, only to be met with downpours.
Less, but more often
Even though it rains less in Copenhagen in the start of the year than in Paris, it actually rains more or less as often (a half-day difference), as shown in Figure 3. In summer however, it rains much more often in the Danish capital (3 to 5 more days in July to September)
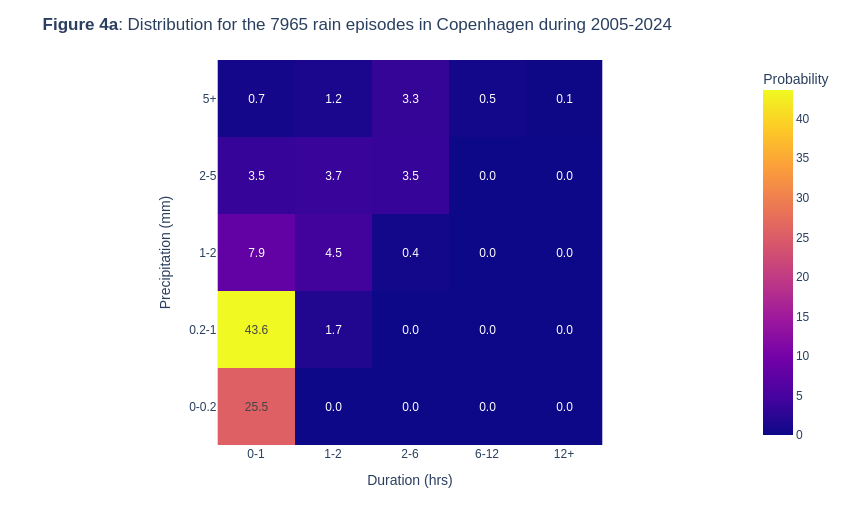
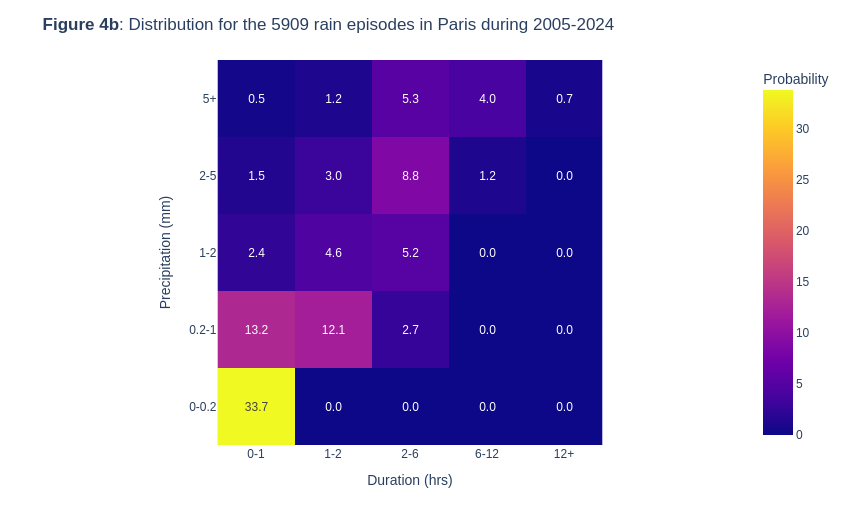
Overall, it actually rains more often in Copenhagen: there has been 35% more rain episodes (i.e. contiguous periods with total precipitation amounting to 0.1mm or more) during the last 20 years. When we look at the distribution of those episodes (see Figure 4), we can see that there's lots of small rain episodes in Copenhagen (~70% of rain episodes last less than one hour and lead to 1mm or less rainfall), while Parisian rain episodes tend to be in part longer and heavier (10 times more rain episodes of 6 hours or more and 2mm or more rainfall).
It's more than just rain
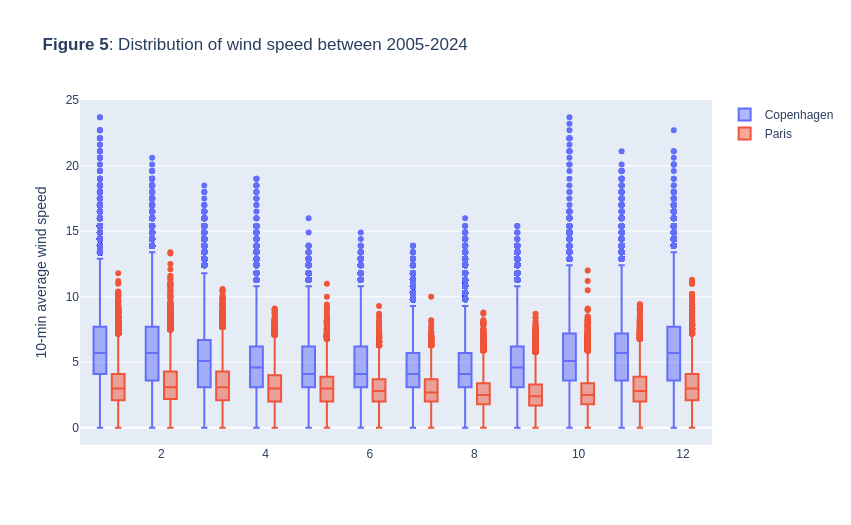
Perceptions of Copenhagen's climate has also to do with the combination of other elements: temperature, lightness/darkness, cloud cover/amount of sunshine, and wind. Denmark being the birthplace of wind power, we can guess that its capital is relatively windy. And that is definitely visible in the data (see Figure 5): wind speed in Copenhagen is on average way higher than in Paris (like twice as windy in the colder months) [2]
Conclusion
It rains more in Paris than in Copenhagen, especially in the first half of the year which is typically dryer in the Danish capital. But there are also seasonal variations, frequency and intensity differences that explain the relatively strong perception of Copenhagen as being a very rainy city.
Beyond rain, other parameters like temperature, wind and the amount of sunshine explain more globally the perceptions one can have of the Danish climate compared to their homecountry. This may be the subject of a separate blog post, or several, as Copenhagen's climate can be a long source of debate.

Methodology
Open Data
Meteo France and DMI both make weather data from their met stations publicly available via an API. French data is also available directly in the form of csv files on a sub-section of the national Open Data portal.
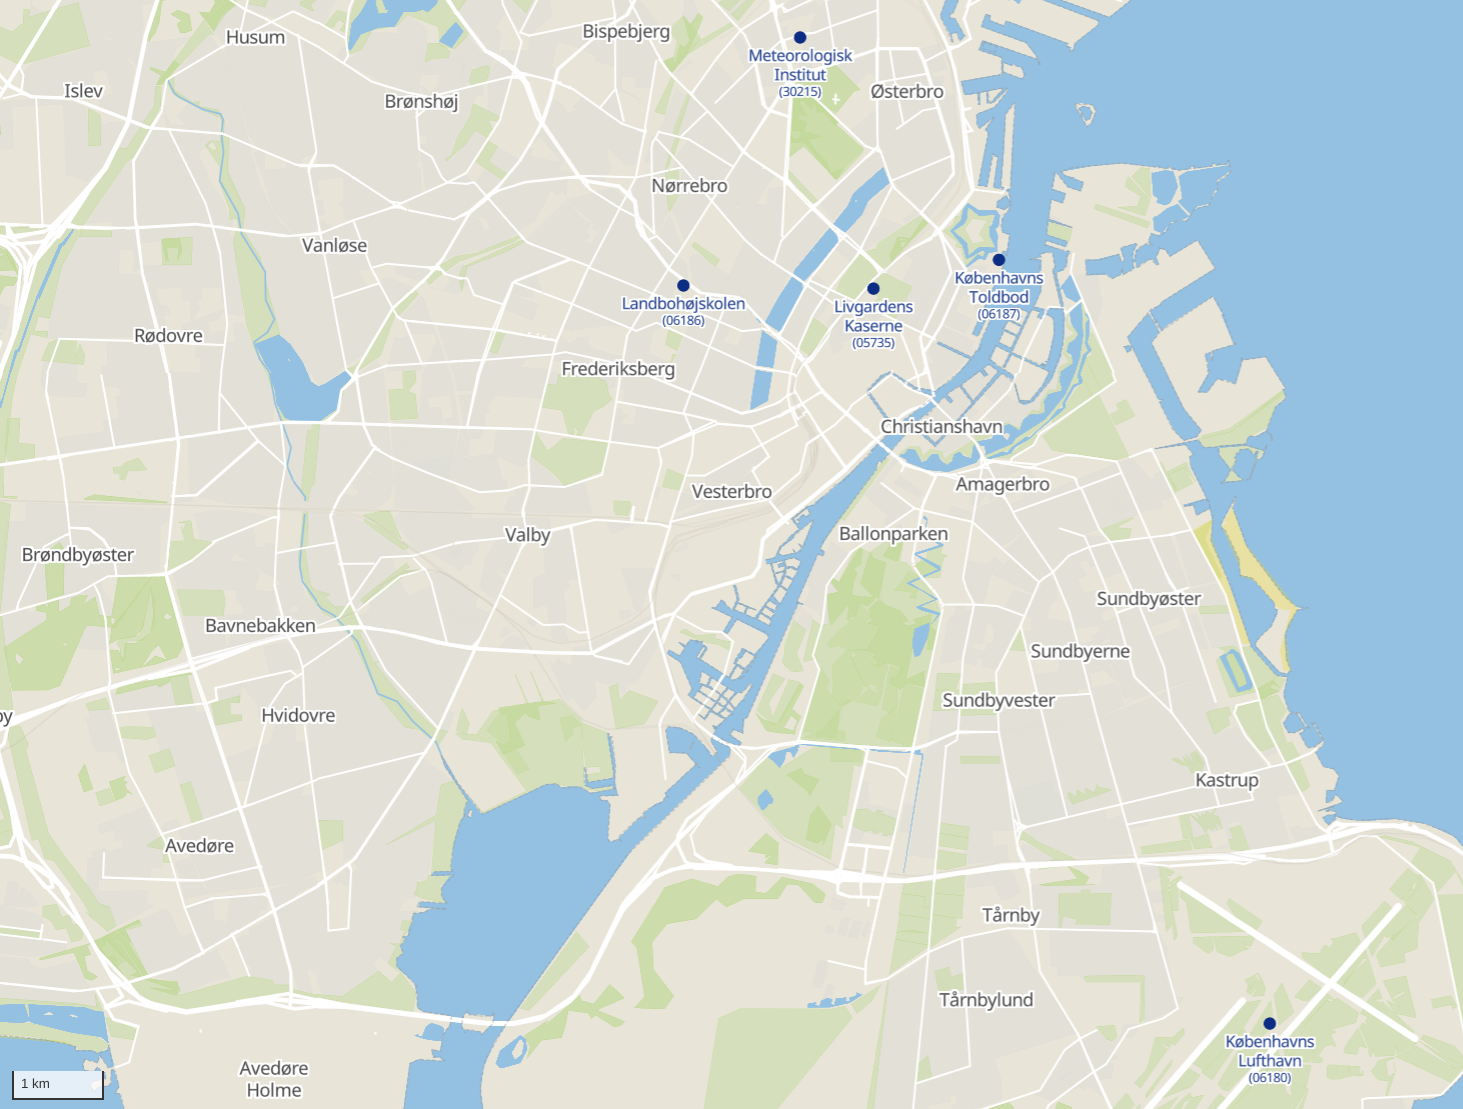
- DMI’s API enables mass download of years of data with a permanently valid API Key (provided one makes a loop to overcome the limit of 300,000 rows per request). It just takes a bit of time to select the right met station, as the stations have more or less recent data, and may provide only a subset of the parameters of interest. For instance, of all the stations shown in the map below, only Copenhagen Airport provides a broad range of parameters (incl. wind speed for instance) but not amount of sunlight (which is only available at Københavns Toldbod).
- Meteo France's API is way more cumbersome and has a bit more time-wise "entry cost". One's API Key needs to be activated after a short fixed period of validity, and the system is a two-step approach consisting in ordering a file to be generated and then fetching it (and only once) once it's ready. I got lazy, and downloaded csv files from the Open Data portal as my need was a one-shot analysis.
Jupyter Notebook
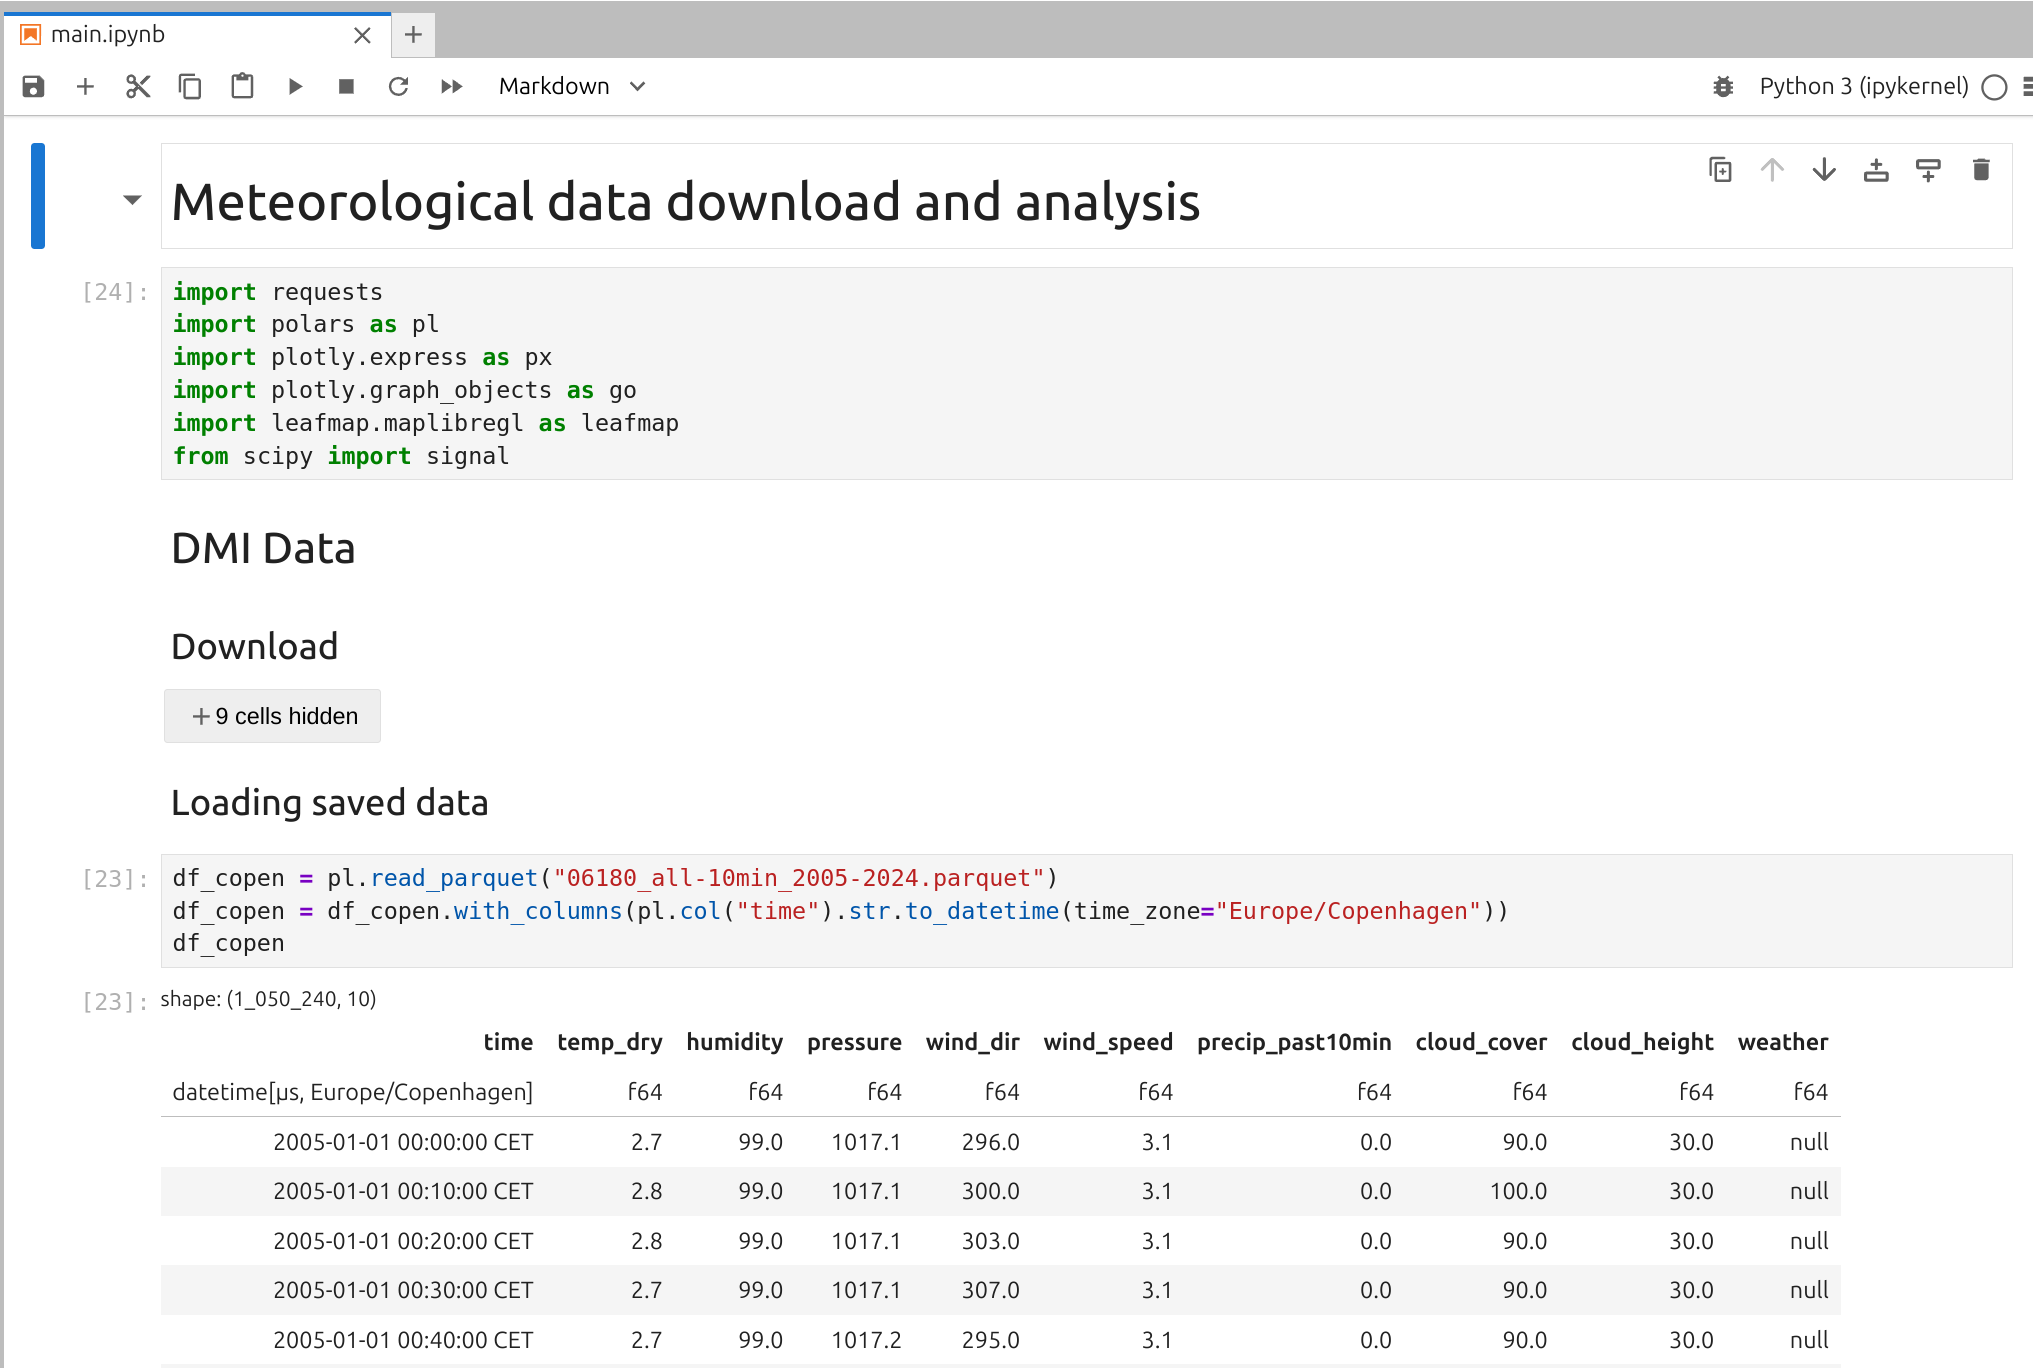
I used a Python notebook in Jupyter Lab in order to gradually document my code and the analysis that followed. It allowed for making quick iterations and mix code and results in the same window.
In the screenshot below, you can see the packages that I used:
requeststo communicate with the APIpolars(a faster alternative topandaswritten in Rust) for data manipulationplotlyas graphing library, also used on this webpage when reasonableleafmapto generate the map in the previous sub-sectionscipy's signal module to smoothen the rolling 31-day rainfall curve by applying a Savitzky-Golay filter.
References
- [1]: Le Point (2024), Paris a battu son propre record historique de pluie en 2024, https://www.lepoint.fr/environnement/paris-a-battu-son-record-historique-de-pluie-en-2024--25-12-2024-2578675_1927.php
- [2]: Wind speed between two met stations should be compared carefully. In Copenhagen, the met station is at the airport, which is likely free from nearby obstacles (I haven't found its spec sheet). In Paris-Parc Montsouris, wind measurement is classified as a Class 4 measurement, due to obstacles as shown in this video. Nevertheless, the two datasets are a good starting point for comparison.